d. Peer
Review at George Mason University
Due to
the sensitivity of the notification process, the significance of the follow-up
epidemiological studies, and the intense interest of the atmospheric science
community, the DHS convened a panel of experts in the fields of meteorological
and turbulent diffusion modeling to review the DoD and CIA work. The panel,
consisting of Richard Anthes, University Corporation for Atmospheric Research;
Bruce Hicks and Will Pendergrass, National Oceanic and Atmospheric Administration;
and Steven Hanna, George Mason University, participated in a meeting at George
Mason University in Fairfax, Virginia on November 4-5, 1997. The primary purpose
of the panel discussion was to assess the scientific credibility of the Khamisiyah
modeling results publicly released in July 1997, with an additional assessment
of the modeling methodology and model selection. The panel members received
a copy of the draft technical report one week before the meeting.
At the
meeting, a CIA contractor briefed the Pit demolition, the Dugway rocket tests,
and the Edgewood and Dugway agent evaporation tests. Meteorological modelers
briefed their models’ capabilities, supporting publications, configurations,
and modeling results and performance measures. Dispersion modelers from the
CIA (NUSSE4), NSWC (VLSTRACK), and DTRA (HPAC/SCIPUFF) presented their analyses
of the Pit release and an overview of their model’s validation.
The panel
prepared a December 11, 1997, report, "Comments by Peer Review Panel on
Khamisiyah Modeling Report and Presentations on 4-5 November 1997"
(Anthes et al., 1997). On the question of using outputs from several independent
meteorological and dispersion models to determine the area within which ground
personnel were at risk of exposure, the panel stated: "The panel endorses
the DoD decision to base its estimates of potentially-affected personnel on
the union of all the model outputs."
The panel
discouraged using computationally inexpensive operational models and suggested
using state-of-the-art high-resolution models with the fewest physical limitations
and assumptions. In addition, the panel commented on the significance of several
topics, including spatially- and temporally-varying atmospheric stability, accurate
mixing-layer heights, and inconsistencies in the dispersion models’ results
using the same nominal meteorological input data. On modeling strategy and the
selection of models, the panel noted:
- COAMPS also is credible,
with supporting peer-reviewed articles. Its reanalysis is comprehensive and
the error diagnostics indicate the baseline run meets or exceeds the performance
expectations for mesoscale meteorological models in general.
- OMEGA, the DTRA-sponsored
model, does not yet have corresponding published peer-reviewed articles as
of 1997. In addition, the panel found some OMEGA solutions questionable (e.g.,10�
C temperature errors and wind speed errors of more than 20 knots).
- MM5 is a very credible
model (with about 300 peer-reviewed articles) and was run by one of the model’s
developers. However, the panel found that the 1997 model simulations were
not as complete compared to the DoD mesoscale analyses.
- Comparing the meteorological
model results with observed trajectories of the oil-well fire smoke plumes
may be misleading because of the uncertainties about the elevations of the
observed plumes.
- Since material transported
above the mixing layer may have dominated the oil-well fire smoke plumes,
the panel assigned greater importance to comparisons with local soot patterns
at Khamisiyah.
The panel
also issued these findings on the dispersion models:
- Of the three dispersion
models that were used, only HPAC/SCIPUFF had been subject to a thorough peer-review
process and published extensively in refereed journals.
- VLSTRACK and HPAC/SCIPUFF
assumed different transport speeds for near-surface puffs, potentially leading
to large inconsistencies.
- VLSTRACK and HPAC/SCIPUFF
used different source inputs (i.e., internally versus externally specified),
which complicated comparisons.
- Other US agencies sometimes
also use Eulerian or hybrid Eulerian-Lagrangian. HPAC/SCIPUFF and VLSTRACK
are Lagrangian models.
C.
REFINED KHAMISIYAH ANALYSES (FOR 2000 MODELING)
1. Introduction
In addition
to the issues raised by the George Mason University panel, agent removal effects
(e.g., decay and vapor deposition) also required serious consideration. The
July 1997 results did not fully represent the agent removal effects because
empirical data was lacking and more inclusive hazard areas were preferred. The
Senate Special Investigative Unit on Gulf War Illnesses also identified these
omissions in its August 1998 report. Other deficiencies in the 1997 modeling
are as follows:
-
Inconsistencies
In Dispersion Calculations For Same Source And Same Meteorology
Dosage
patterns for the July 1997 VLSTRACK and HPAC/SCIPUFF model runs based on
the same meteorological input showed a discrepancy (Figures
A-58 and A-59). Dispersion results strongly
depend on the puff tracking heights for near-surface releases. For all runs
conducted prior to the November 1997 George Mason University panel review
meeting, VLSTRACK used either the puff centroid or the height of interest
as the effective tracking height, while HPAC/SCIPUFF used the maximum of
the centroid and 0.6 cloud vertical sigma. Subsequent to the review
meeting, NSWC ran VLSTRACK using the HPAC/SCIPUFF near-surface tracking
algorithm, which resulted in plumes with trajectories quite consistent with
the corresponding HPAC/SCIPUFF output (Figures A-58
and A-60). NSWC has since proposed a vertical
tracking and splitting algorithm using the maximum of the centroid and 0.6 cloud
sigma.
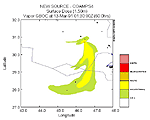
Figure
A-58. HPAC/COAMPS4 predicted four-day cumulative
dosage contours
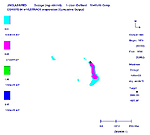
Figure
A-59. VLSTRAC/COAMPS4 predicted four-day cumulative
dosage contours (original tracking height)
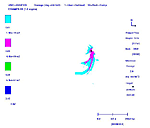
Figure
A-60. VLSTRAC/COAMPS4 predicted four-day cumulative
dosage contours (revised tracking height)
-
Inconsistency
in the Source Term
Because
of the pressure to release modeling results quickly, the July 1997 simulations
used inconsistent source terms (e.g., the internal evaporation algorithm
for VLSTRACK versus the DPG evaporation curve for HPAC/SCIPUFF). A common
source characterization, the DPG evaporation curve, was used for all subsequent
simulations.
Therefore,
the DHS intensified its efforts to obtain more refined exposure assessments.
The inconsistencies in the puff tracking algorithm and the source term mentioned
above were resolved for the refined (2000) modeling. In addition the following
sections describe in detail the improvements made to meteorological modeling
and the unit location and personnel data. The results are more refined estimates
of possible exposure to servicemembers from the demolition in the Khamisiyah
Pit.
2. Refined
Meteorological Modeling
a. Models’ Improvements
Since 1997,
several new simulations of MM5, OMEGA, and COAMPS were made to update the description
of the mesoscale meteorological conditions near Khamisiyah. The large-scale
fields used to initialize the mesoscale models and to provide the lateral boundary
conditions are largely the same as those used in the 1997 modeling. The improvements
made to COAMPS, OMEGA, and MM5 are described below.
1)
COAMPS. As mentioned before (Table A-9) in 1997, in addition to the baseline
analysis (Run COAMPS 7), alternative COAMPS analyses were performed that consisted
of (Westphal et al., 1999):
- An analysis where all
observations within the COAMPS 15-km grid were denied to the data assimilation
process (Run DD15 or COAMPS 3);
- NOGAPS and COAMPS analyses
where all observations within the COAMPS 45-km grid were denied to the data
assimilation process (Run DD45 or COAMPS 4); and
- NOGAPS and COAMPS analyses
where random, bounded errors were introduced to the global observation database
according to the type and altitude of the observation (Run RPO or COAMPS
6).
The baseline
analysis was used in the 2000 modeling. In 1997, however, COAMPS 4 was chosen
for dispersion modeling based on comparison to the ground soot patterns due
to bunker explosions. COAMPS 4 is equivalent to running COAMPS in pure forecast
mode with no data assimilation. The peer review panel questioned the decision
because intuitively a data-denial run should give inferior results. Furthermore,
the COAMPS developers also recommended the use of the baseline analysis. Therefore,
COAMPS 7 was used in the 2000 Modeling.
2)
OMEGA. The following improvements incorporated into OMEGA version 3.7 used
for the 2000 modeling:
- OMEGA 3.7 now runs with
12-hour intermittent FDDA. Previous OMEGA runs were made in a pure forecast
mode, i.e., the observations were assimilated only once at the start of the
integration;
- The OMEGA 3.7 grid generator
is capable of producing higher resolution around selected points (i.e., enabling
observational sites, thus improving the incorporation of those observations
into the initial conditions);
- OMEGA 3.7 uses a time-split
advection solver, which groups the cells according to the maximum advective
time-step possible in the cells. Thus, the high-resolution portions of the
domain can be integrated with a smaller time-step, while the low-resolution
regions use longer time-steps. This increases the computational efficiency
of the model;
- OMEGA 3.7 has an improved
semi-implicit solver to damp acoustic modes, resolving acoustic problems observed
with OMEGA 2.0. In addition, near the top of the model domain, OMEGA 3.7 has
several model layers (sometimes called sponge layers) with the damping factors
chosen to further prevent spurious waves from being generated and propagated
downward;
- OMEGA 2.0 used a fairly
simplistic first-order turbulence closure scheme (the O’Brien scheme)
for the Khamisiyah simulations. OMEGA 3.7 uses a more complete, higher-order
k-e turbulent kinetic energy formulation;
- OMEGA 3.7 includes a
spatially inhomogeneous ground surface characterization in its PBL scheme.
OMEGA 2.0 assumed surface characteristics to be spatially uniform;
- OMEGA 3.7 contained
additional data ingest routines to allow more flexibility in the input data
formats. However, this is not relevant to the 2000 exercise, as the same observational
data were used to run both OMEGA 2.0 and 3.7.
See Bacon
et al., (2000) for OMEGA 3.7’s application to the Khamisiyah analysis.
3)
MM5. The new MM5 reanalysis consisted of four six-day simulations using
continuous data assimilation (see Table A-13). As with the spring 1997 reanalysis,
NCAR performed these simulations with different options for the PBL parameterizations
and global data for lateral boundary conditions and assimilation. In addition,
a simulation was made with a variation in the surface roughness length. This
simulation was motivated by the fact many mesoscale models historically have
employed a default roughness length of about 10 cm for desert. This value may
be appropriate for some southwestern US deserts with large brush and scrub trees,
but surface roughness less than 1 cm probably is more appropriate for barren
desert with scattered, limited vegetation (e.g., Oke, 1987). Thus,
in Simulations 1, 2, and 3, the lower values of desert roughness length were
employed to be consistent with the surface conditions of the Arabian desert
(1 cm for vegetated desert and 0.5 cm for unvegetated desert). In Simulation 4,
otherwise the same as Simulation 1, 10 cm was used.
Table A-13. Configurations
for MM5 simulations
|
Simulation
Number
|
Large-Scale
Analysis
|
Boundary-Layer
Parameterization
|
Desert
Roughness Length (cm)
|
|
1
|
TOGA/ECMWF
|
MR
|
~
1
|
|
2
|
NCEP
|
MR
|
~
1
|
|
3
|
TOGA/ECMWF
|
Blackadar
|
~
1
|
|
4
|
TOGA/ECMWF
|
MR
|
~
10
|
Systematic
performance evaluation shows Simulation 2 performed slightly better than the
rest. To quantify model performance, the mean error (ME), the mean absolute
error (MAE), and the root mean square error (RMSE) are calculated for predictions
of wind speed, wind direction, temperature, and dew point temperature:
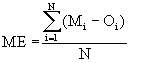 |
(Equation
A-34)
|
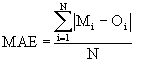 |
(Equation
A-35)
|
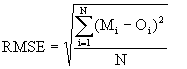 |
(Equation
A-36)
|
where Mi
and Oi are the ith pair of model prediction and observation,
and N is the total number of pairs. Separate statistics were calculated for
- Grids 1, 2 and 3;
- Low-level (lower than
850mb, or roughly 1500 m) and upper-air levels (lower than 5000 m).
In addition,
NCAR made the following improvements to MM5:
- The resolutions for
land-use properties for the old and new runs were 18 and 1 km, respectively;
- The old runs covered
40 hours of simulation time, from 0000 UTC March 10 to 1600 UTC March
11, 1991. The new runs covered 144 hours, from 1200 UTC March 9 to 1200 UTC
March 15, 1991;
- The first-guess fields
and lateral boundary conditions used in the 1997 model runs were based on
either the NCEP AVN model forecasts or the global reanalysis ECMWF specifically
produced for the Tropical Ocean Global Atmosphere (TOGA) project. The 2000
model runs used either the NCEP global reanalysis or TOGA/ECMWF reanalysis;
and
- All 2000 model runs
used now-declassified observations, many of which were still classified in
1997, for model initialization and data assimilation.
Warner
and Sheu (2000) provide further details of how NCAR applied MM5 to the Khamisiyah
analysis.
b. Khamisiyah’s
Predicted Flow Fields
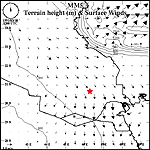
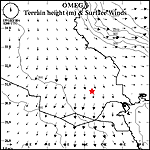
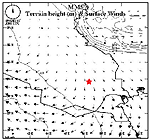
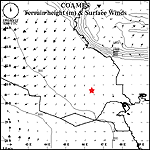
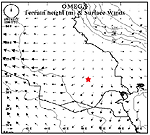
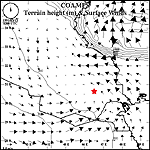
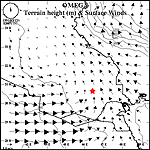
Figures
A-61 through A-72 show the surface wind vectors
the three mesoscale models produced for the 2000 Khamisiyah analysis every 24 hours
for 1200 UTC March 10, 1991, through 1200 UTC March 13, 1991. Wind vectors
are plotted only at every half degree for legibility, although the model resolution
is much higher. Moreover, the surface wind fields refer to 10, 40, and 30 m
above the ground for COAMPS, MM5, and OMEGA, respectively.
At the
time of the release (near 1200 UTC March 10, 1991), all three models produce
near-surface winds out of the northwest over Khamisiyah (Figures
A-61, A-62, and A-63).
Furthermore, these figures also show the sea breeze effect that drives wind
flow counter to the
prevailing circulation over the Persian Gulf’s northern coast. Consistent
with the earlier predictions, the low-level flow south of Khamisiyah shifts
from the northwest to the north-northeast over the next 24 hours (i.e., 1200
UTC March 10, 1991, through 1200 UTC March 11, 1991).
Figures A-64, A-65, and A-66,
reflect this shift, which is consistent with the evolving large-scale conditions.
Comparing the individual plots, we see the near-surface flow fields are fairly
consistent with the plume trajectories generated in 1997, and individual model
differences are generally limited to locations exterior to the hazard area footprint.
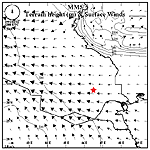
Figure
A-61. 2000 MM5 Grid 3 predicted
wind fields for 1200 UTC March 10, 1991
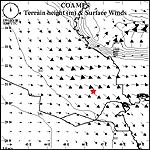
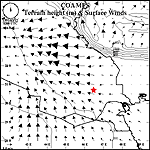
Figure
A-62. 2000 COAMPS Grid 3 predicted
wind fields for 1200 UTC March 10, 1991
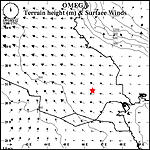
Figure
A-63. 2000 OMEGA Grid 3 predicted
wind fields for 1200 UTC March 10, 1991
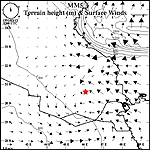
Figure
A-64. 2000 MM5 Grid 3 predicted
wind fields for 1200 UTC March 11, 1991
Figure
A-65. 2000 COAMPS Grid 3 predicted
wind fields for 1200 UTC March 11, 1991
Figure
A-66. 2000 OMEGA Grid 3 predicted
wind fields for 1200 UTC March 11, 1991
Between
1200 UTC March 11, 1991, and 1200 UTC March 12, 1991, the low-level pressure
gradient over the Khamisiyah region intensified, shifting the winds more easterly
(Figures A-67, A-68, and
A-69). Over the next 24 hours (1200 UTC March 12,
1991, through 1200 UTC March 13, 1991), the models show weak cyclonic circulation
driven by the surface low pressure over the area (Figures
A-70, A-71, and A-72).
Figure
A-67. 2000 MM5 Grid 3 predicted
wind fields for 1200 UTC March 12, 1991
Figure
A-68. 2000 COAMPS Grid 3 predicted
wind fields for 1200 UTC March 12, 1991
Figure
A-69. 2000 OMEGA Grid 3 predicted
wind fields for 1200 UTC March 12, 1991
Figure
A-70. 2000 MM5 Grid 3 predicted
wind fields for 1200 UTC March 13, 1991
Figure
A-71. 2000 COAMPS Grid 3 predicted
wind fields for 1200 UTC March 13, 1991
Figure
A-72. 2000 OMEGA Grid 3 predicted
wind fields for 1200 UTC March 13, 1991
| First Page | Prev Page
| Next Page |