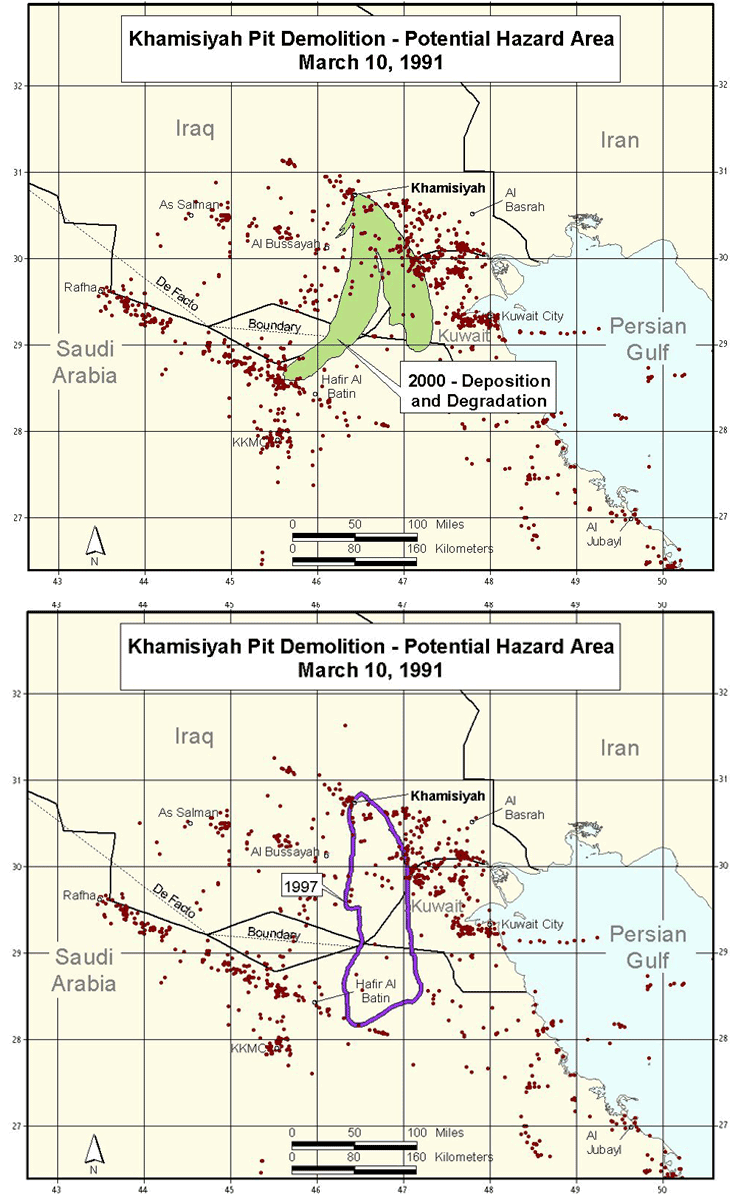
Figure
6. The combined General Population Limit contours predicted by all models for
Day 1, March 10, 1991
Top: The 2000 results assuming dry gasesous deposition and agent decay; Bottom:
the 1997 results

| First Page | Prev Page | Next Page | Back to Text |